From scattered VLF listening to methodically acquiring data
by Renato Romero
What is a VLF observatory? It is a VLF receiving station with one or more VLF receivers always running. In this radio station, unlike a classic amateur radio station, received data is saved. The spectrograms with their plottings and signal levels, and the signals themselves are stored to be available on our PC for consultation, even several years later. A monitoring station that can have scientific functions: such as the study of VLF radio signals correlated with earthquakes. Difficult to activate? ...maybe less than you think.
The shopping
list
What do I need to activate a monitoring station
on-line? There are some things that we cannot give up:
- a quiet place suitable for the reception of VLF
(this may possibly be your garden)
- one or more receivers/antennas for VLF signals
- a PC dedicated only to this application and always
running
- a little UPS unit
- a bit of free software that we detail shortly
- a willingness to spend some money on electricity
- a little dedication: The system works by itself
but requires maintenance.
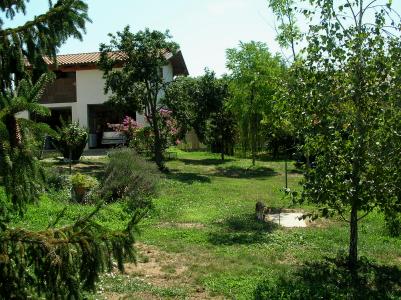
A quiet place
To monitor and measure VLF first we need a good
signal: it may seem trivial, but you have to start here. You need to find
a quiet place, away from industrial noise and away from power lines. A
desert would be the ideal location, but a cottage in the countryside with
a garden around it can often be the real answer. We know that the signal
of "natural radio" is very weak. In our townhouse it is present but is
completely covered by the AC hum coming from the power supply lines. Each
appliance in our house is a powerful source of VLF signals and thus an
obstacle to receiving those from Nature. A switching power supply, neon
bulb lamp, television, computers and even solar panels, with their power
control devices (the charge regulator), are an obstacle to good reception.
 |
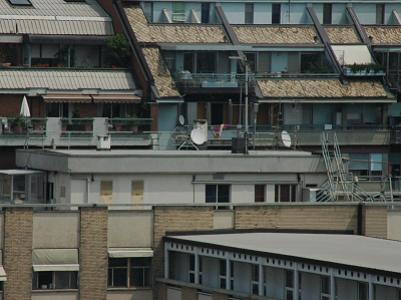 |
A quiet corner in my garden, good for VLF reception,
and a piece of urban area in Turin, ...not good for a VLF observatory.
RECEIVERS and
SENSORS
One could write many words about it. The reception
of radio signals of natural origin has several approaches. You can monitor
the signals in a broad spectrum, from a few hundred Hz to 20 kHz. Or you
can put the focus on lower frequencies, ELF and ULF bands, where there
are natural radio signals such as the Schumann resonances and also military
signals that are directed to submarines. We can also attach a geophone
and have with the radio landscape also the acoustic signal situation: this
may help in the study of seismic-precursor signals.

Some receivers presented on this website, and other
commercial solutions. Starting from left/top: Floating Solar Receiver,
Easy Loop, geophone sensors, B3CKS antenna, ICS101 induction coil, Explorer
E202.
You can find many projects for receiver construction
on this site. See the home page www.vlf.it . To start with this project
the first thing to do is to have a portable receiver. With it you can explore
the area around your property looking for an electrically quiet location.
We connect the
receiver to the PC
...and many times here the trouble starts. We found
in our garden, in a corner not too close to home, a suitable place. But
as soon as we connect the receiver cable to the PC in the house the quiet
place becomes noisy: the natural radio signals are replaced with strong
hum noise! What happened? By connecting the receiver to the PC we directly
convey the hum noise to the receiver: it is a problem because we have installed
the receiver outside just to escape from the hum noise inside. The same
thing happens when you try to power your receiver with the AC Mains instead
of a battery. If you are using an electric field receiver there are only
three possible solutions to this problem. -Electrically: to isolate the
signal line with an audio transformer and power the receiver with a battery.
The battery can be kept charged with a small solar panel with simple modification.
-Use an antenna larger than the simple stylus: it increases the strength
of natural radio signals received while the HUM noise level remains almost
constant. The result is that the S / N ratio improves. For my Cumiana Monitoring
station I chose this second solution, with a big Marconi antenna. -Replace
the electric field receiver with a magnetic field receiver: for example
the EasyLoop (http://www.vlf.it/easyloop/_easyloop.htm
). This kind of receiver is less sensitive than the first one to conducted
hum noise. But the magnetic field receiver is affected by all the stray
magnetic fields of transformers and motors around the house and property:
in any location the signal coming out of an EasyLoop can be much worse
than the one received with the electric field receiver. The situation should
be evaluated carefully. We must do many tests and every place has its own
characteristics that distinguish it from others. It's impossible to tell
if a site is suitable for VLF reception without doing some testing first.
What kind of
PC?
The computer should not be old. If you intend to
put data online a machine manufactured after 2005 may be new enough. Many
processes must be run simultaneously and require a large HD to store the
data: at least a 250 GB HD, 1 GB of RAM and 1.6 GHz clock speed or higher.
These are the minimum requirements. You will also need one or more sound
cards depending on how many receivers you want to put on line. The basic
sound cards are good (Creative, Yamaha ...): we don’t need special effects
like Dolby Surround, 3D sound etc.
Even a single sound card or a good quality USB
external card is fine. But if you use more than one sound card use PCI
only. It is because the electrical ground for the USB card is different
from that used by the PCI sound card. In the same system the two methods
are exposed to noise generated by the PC, especially if they are connected
together.
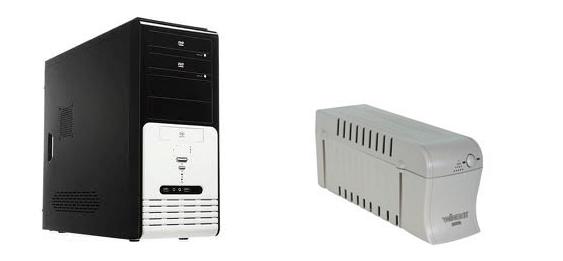
A used assembled PC and a new UPS
are sometimes the cheapest solution.
How big should
the UPS be?
UPS? We need a UPS? Unfortunately, yes. It can
be very small, a few hundred watts. With only a few tens of €/$ we
can solve the problem. But it is essential. To keep the monitoring station
on-line your PC will run many applications. These can be loaded automatically,
but several (like SpectrumLab) can fail to start automatically. This is
especially true if there are many files of a single active SpectrumLab
session. It means that even a brief power failure can sabotage the system:
in most cases it will not be able to restart itself and you have to restore
it manually. This should be avoided. A UPS also helps protect your PC from
external surges.
Lightning protection
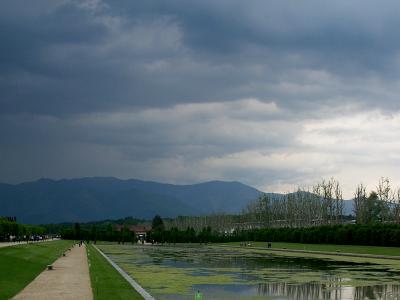
This is a sad topic. Receiving stations located
in the countryside are at very high risk of lightning. It is because the
power lines in the country are usually above ground. It exposes them directly
to the risk of being struck by lightning. In addition, they can function
as an antenna: even if the lightning does not fall on the line directly,
during a thunderstorm the end user can be subjected to voltage surges over
1000 Volts. But at the same time, the stations in the city which are less
at risk are less suitable to listening to natural radio signals because
they are submerged in the hum noise. The direct consequence is that usually
a good location is very risky.
There are three access routes to be protected:
- the antenna and receiver connected to the soundblaster
(use proper circuit protection to prevent damage to your audio card)
- the power supply of the PC, router and other
equipment (use proper AC protection device)
- the telephone line that connects to the modem
or router (use proper telephone line protection device)
Despite all these protections you need to be ready
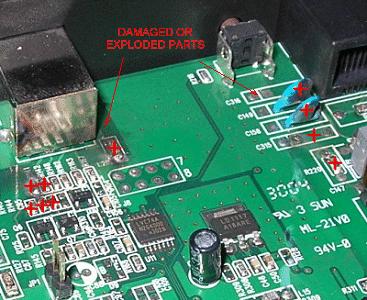
for the worst. In 10 years as a monitoring station OpenLab burned: 3 Computers,
6 Audio Cards, 2 Modems, 2 Routers and many other devices such as electric
line protection, stabilized power supplies and various receivers that I
repaired by myself. These words are not to discourage those who would start,
but only to avoid unpleasant surprises when the first storm comes. It is
very rare, but it does happen sometimes.
 |
 |
Well, now that all the hardware is ready we can
move on to the software and start programming.
SpectrumLab
This is the king of programs for real-time analysis
of audio signals. It is free and can be downloaded directly from the web
site author: Wolfgang Buscher http://www.qsl.net/dl4yhf/spectra1.html .
This software allows us to process spectrograms, to plot signal levels,
to record audio files and to create an archive of the activity. Let's see
how.
We can simultaneously open several sessions of
Spectrum Lab and in each session choose which sound card to use. This means
we can make different calculations on the signals, using a single sound
card. And it also means that we can have on a single computer multiple
sound cards (such as 3) and have running many Spectrum Lab sessions (for
example 8). The things we can do with a PC, sound cards and SpectrumLab
are nearly endless!
SpectrumLab/Spectrogram
settings for slow signals
There are many ways to represent a signal: the
spectrogram is one of the most complete ways. But there are many ways to
set a spectrogram: is the signal to be analyzed is slow or fast? For slow
signals a very useful representation can be obtained with following settings:
 |
 |
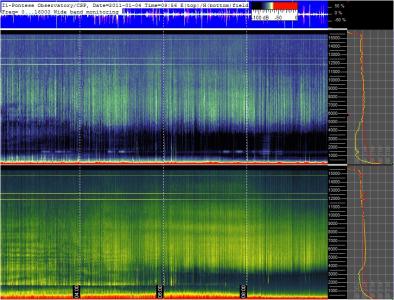
| Sampling Rate: 32000 Samples / second
FFT Resolution: 524288 points Scroll Time: 40 seconds Frequency range shows: 0-15000 Hz |
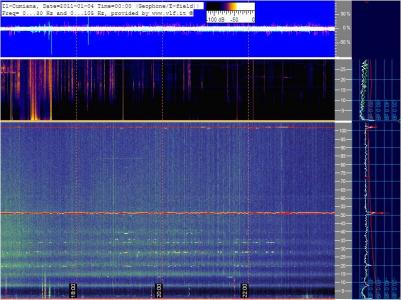
Sampling Rate: 5512 Samples / second
FFT Resolution: 65536 points Scroll Time: 40 seconds Frequency range shows: 0-30 Hz and 0-105 Hz |
Left picture shows the VLF activity at Pontese Observatory,
with electric field on top and magnetic field on bottom. Right picture
shows the ELF/ULF activity at Cumiana Observatory, with acoustic geophone
signal on top and electric field on bottom. An 800 pixel base size
picture shows the last 8 hours activity: it is useful to see if there are
long-term changes present in the signal.
| The choice of color palette is important, especially if there is more than one monitoring system in operation. In the “VLF Openlab Observatories" network we use green for the magnetic field, blue for the electric field and purple for sounds coming from the geophone. |
In this way, the signals become more easily recognizable,
especially if you run two or more receivers with multiple sessions.
SpectrumLab/Spectrogram
settings: fast signals
The previous representation is not able to detect
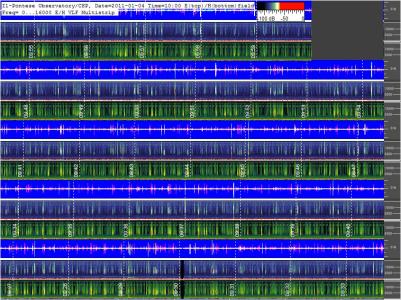
signals that have a faster evolution. So then the multistrip representation
helps us grab the fast signals. Also we can save space in the spectrogram
representation; Using multistrips is both faster and smaller.
 |
 |
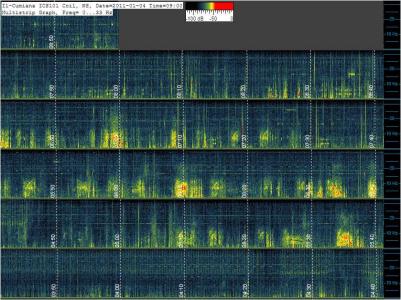
| Sampling Rate: 11025 Samples / second
FFT Resolution: 65536 points Scroll Time: 4525 milliseconds Frequency range shows: 0-33 Hz |
Sampling Rate: 32000 Samples / second
FFT Resolution: 32768 points Scroll Time: 512 milliseconds Frequency range shows: 0-30 Hz and 0-105 Hz |
Left picture shows the signal coming from an induction
coil for ULF observing, placed in Cumiana Observatory. Right picture shows
the VLF activity at Pontese Observatory, with electric field on top and
magnetic field on bottom (as before).
SpectrumLab/Spectrogram
settings for plottings
The plotting shows the trend of signal levels at
different times. It is considered a very important method of representation
especially for researchers in the field of seismic activity. It represents
how the signals would be viewed on paper like on an old plotter. It is
certainly important if coupled with spectrograms.
Here below are examples with 4 traces. Three traces
show signal levels: two coming from antennas and one coming from the geophone.
A fourth trace (the yellow one) has been used to monitor the frequency
of a signal here which in this case is the second Schumann resonance.
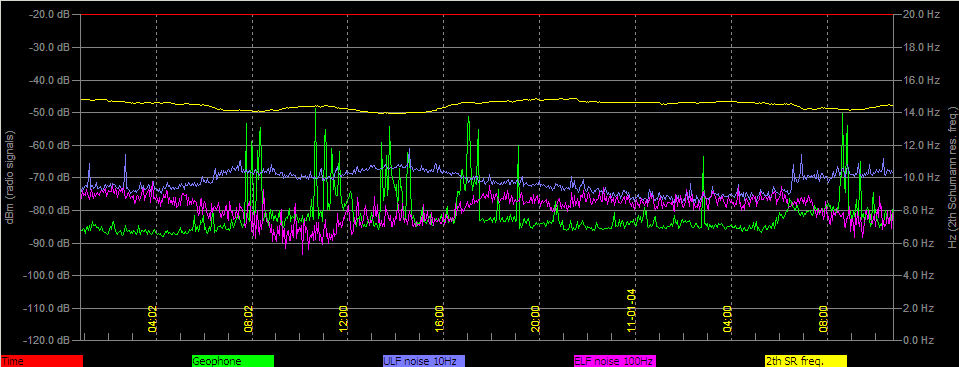
The scroll time is 150 seconds for step and the
window shows the last 32 hours activity.
Here below the setting used:

Spectrum Lab has a rich set of commands for the plottings. They are in the instructions, see “Interpreter commands”. Here this fourth frequency function has not been obtained with the simple command interpreter of Spectrum Lab. It was edited as a macro (read “Wolfgang Buscher edited a macro for me”), to obtain a smoothed trace: here are the details.
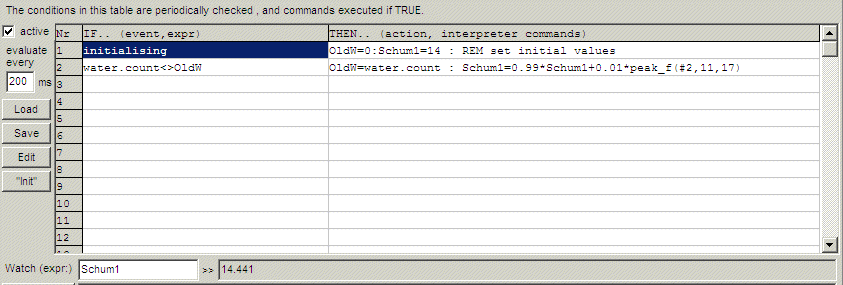
Macros are a great resource for this software. It
performs thousands of functions alone, but if we want a special feature
we can program it.
SpectrumLab/Spectrogram
settings for overlay and archive
The spectrograms obtained need to be saved automatically.
The files must be stored and they must be identifiable for the next consultation.
The name of the file should contain the date, time, and the type of signal
saved. The image of the spectrogram should contain the same data. Do not
worry: If you use Spectrum Lab all this is possible. A small Overlay in
the picture, superimposed when the image is saved, shows the recording
conditions:

This can be set by the Screen Capture options window:
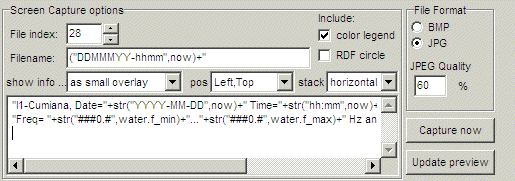
To obtain the overlay above we have put in this command string:
"I1-Cumiana, Date="+str("YYYY-MM-DD",now)+" Time="+str("hh:mm",now)+"
(Geophone/E-field)) "
"Freq= "+str("###0.#",water.f_min)+"..."+str("###0.#",water.f_max)+"
Hz and 0...105 Hz, provided by www.vlf.it "
And to periodically save spectrograms and plotting pictures you can use the Periodic actions:
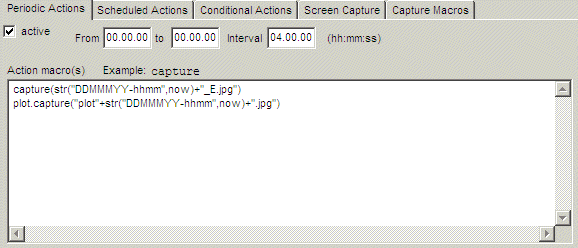
In this way, automatically, every 4 hours, the spectrogram
and plotting pictures are saved, with complete data hour and name. Your
archive will soon become large and contain many files. Even so it will
be easy to find the right file thanks to the name that identifies them.
SpectrumLab/Spectrogram
settings for wave files archive
In the study of low-frequency signals it can be
useful to re-analyze the signal a second time. This is not possible if
you have not saved a wave file. Spectrum Lab allows this operation. Obviously,
this makes sense if the saved file has a low sampling rate and bandwidth.
If you save the entire range of the sound card it will occupy much disk
space, so your HD will be full within days. It is therefore appropriate
to set the decimation of saving to only a part of the acquired band. Activate
in the Wave files Save Options the “decimate saved audio sample” option,
and set a proper value of samples/sec.
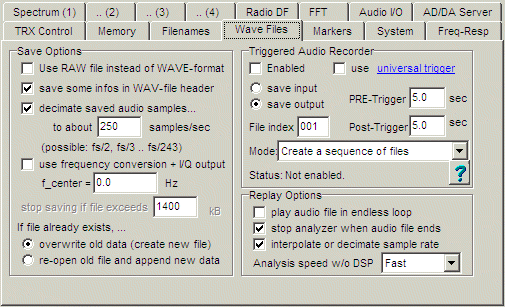
Here we set about 250 Sample/sec: the saved bandwidth will be 0 to 125 Hz. This can be very useful for ELF and ULF post processing signals. In the same way as before we can put the proper command in the “periodic actions” to save the decimated audio file.
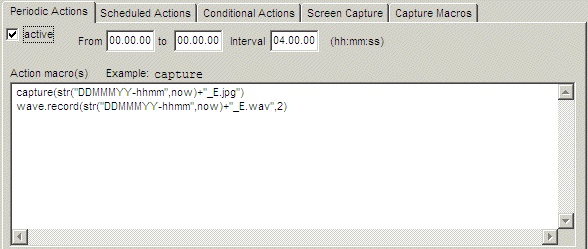
With the “wave.record” function we do the same thing
we did with the jpg file above. Every 4 hours we close the old wave file,
save it with the date and time, and open a new wave file.
AUTOMACHRON
Before you shout to the world that you have a monitoring
station there is still one last thing: to install a program to synchronize
the PC clock. It's embarrassing to look at the received data if you are
not sure of the hour. A PC that works for a year can create a very large
time error. You need a program which periodically connects to a time server
and corrects the error of your clock. There are many software that can
do this work. I suggest AUTOMACHRON. It is free and you can download the
software from here:http://www.brothersoft.com/automachron-download-5937.html
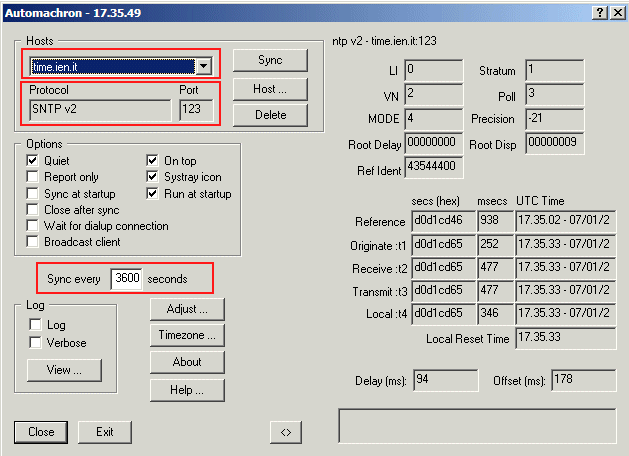
You need to set the time server address (time.ien.it
in the example): (there are many time servers on the web) Then you enter
the protocol type, the port number and the time interval to operate the
synchronization. I think 3600 seconds (1 hour) is a good compromise, but
you can also choose a shorter time.
CONCLUSIONS
Now our VLF monitoring station is active. In a
short time we have a lot of archived files with spectrograms of interesting
signals. We can also go away from home a few days and when we return we
find all our files updated. If there happened to be an earthquake, or there
was a solar storm, we can open our Archive and look before, during and
after the event to discover what interesting data our station has recorded.
Now you are wondering if it’s a difficult thing to put your data on-line;
Not at all. But that’s another story.
MANY THANKS
TO:
Wolfgang Buscher, author of SpectrumLab for the
continuous support.
Return to www.vlf.it index