O.PE.RA.
Osservatorio Permanente
sulle Radioemissioni di Origine Naturale
(Permanent Observatory on
Natura Radio Emission)
by Renato Romero (IK1QFK)
In order to characterize the radio signal reception,
of natural origin, more than the fascinating listening, there is the attemp
of identifiyng the origin. The research of these signals links with their
originating phisics phenomenons, was the target of the present research
lasted about a year, between Apr.1997 and Apr.1998.
TARGETS OF OPERA
During the year which was chosen for the research,
several hundreds of listenig sessions in 100 hz - 10 kHz band have been
done at predeterminate times and in order to collect, during the whole
year a minimum indispensable quantity of data to quantify the number of
these phenomenons as wistlers.
Besides the work of data collecting through the
reception of the electrical field and the magnetic field a research taken
place about physical data related in somewayse to the radionature phenomens.
So, every single day have been recorded meteo conditions at geo-magnetic
conjugate point also including minimum and maximum temperature.
In every single day have been collected data about
the solar radio flux at the geomagnetic activity produced by solar wind
particels and about the numbers of the sun spots.
Target of the research was to identify every possible
link between the various sizes and was also to verify the possibility of
giving forecast about the presence of radio signals of natural origins
even if in a short time terms; last but not list warn eventual observatory
interested just in case of exceptional conditions of propagation in VLF
and ELF.
DETERMINATION OF C.G.M.
The receiving station was based in the northen part
of Italy, near Turin, at geographic coordinate 44° 57 North, 7°
25 East.
As well known, geographic coordinates defer from
the magnetic ones wich are in slow but continuos evolution. The simple
determination of the geographic conjugate point doesn't give an exact informations
about the magnetic correspondent point. The first operation so was to determinate
the geomagnetic coordinates of the receiving place in order to get the
C.G.M. that is the point where originates most of the wistlers that are
occasionally received. The exact determination of the point was given by
a calculation given on Internet at site NASA of NSSDC (National Space Data
Center) at adress:
http://ndssbc.gsfc.nasa;gov/space/cgm/cgm.htm/
To get a huge quantity of data including the ones
of present research you have to imput your own geographic coordinates and
the current date. For the receiving station coordinates (near Turin) the
result is the CGM a few kilometers from Cape Town, South Africa. But if
you appeal to the geomagnetic maps the last new up to date found in Italy
is the one published by the military cartografy wich date back to 1967;
so this is not valid anymore for the targets of our research.
RESEARCH DATA ON CGM METEO
The determination of CGM is necessary to find out
which geographic place must be monitored about meteo conditions for the
compared data collecting. So once it has been found out that the place
wasn't that far from cape town the meteorologic data of that town were
taken as valid ones. The first attempt of meteo maps print sent from polar
satellites was quickly abbandoned: the given images doesn't allow to deduct
the ground meteo situations. Insteade were adopted the data given by INTELLICAST
at internet site:
www.intellicast.com/weather/cpt/content.shtm
The data about meteo conditions include even minimum
and maximum temperatures and three-days-after-requested-date forecasting
as well;
THE DATA COLLECTING ON SOLAR ACTIVITY
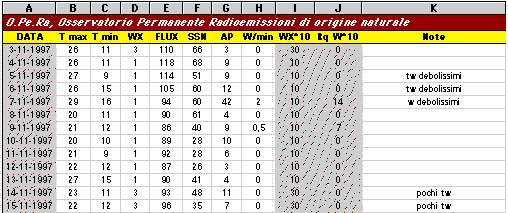
The collected data have been included in a excel page specifying the followings items:
A: listening date
B: maxim temperature at CGM (°)
C: minimum temperature at CGM
(°)
D: meteo conditions at CGM ( 1=clear,
2 = cluody, ... 5 = storm )
E: solar radio flux (observed
at Penticton on 10,7 cm at 2000 ut)
F: sun spot numbers
G: solar wind (AP index)
H: number of wistler per minute
listened in sessions
I: value of column WX multiplied
by 10
J: square root of number of wistler
multiplied by 10
The last two columns have been automatically calculed
by the program and allow to have a value which can be graphically compared
to other greatness without further elaborations.
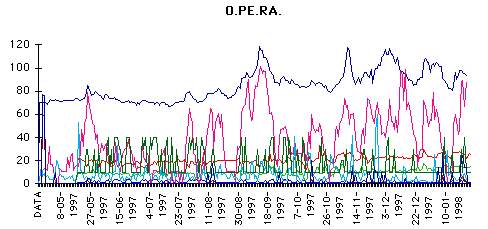
Table, which only shows a few days observations,
has secondarily translated in a graphic form as shown in the example: in
the following graphic you cant deduce many relations between greatnesses
but you can easily and efficaciously visualize the quantity of data which
has been compared.
Actuallty for the practical comparison have been
done graphics on monthly periods on limitated number of values every single
time.
PREDISPOSITION OF RECORDING TIMES
Two dayly sessions have been planned on the observatory
timer, one session corresponds to the maximum sun time and the other when
the
receiver was in the center of the dark zone.
Every recorded session lasted for a minute. At
the end of the year have been finally noted over than 700 sessions.
Every session was recorded in two different ways:
electrical and magnetical.
For every single session the sonograms has been
effected, noted the origin and the quantity of the listened signals.
ADDITIONAL SESSIONS
Automatic session described in the previous paragraf
are not the only ones: two or three sessions per day have been done but
not recorded on tape, lasting from five to twenty minutes.
For every single session have been noted observations
on the gotten phenomenons.
These supplements of listening have permitted the
validity control of the criterions planned during the automatic sessions
for the wistlers quantifying.
By comparing data it has found a mistake at rate
below 5%: that meant that two sessions of one minute per day were considered
enough in order to determinate the presence or the absence of wistlers.
So, supplementary sessions have permitted to obtein
even more precise data.
THE UTILIZED RECEIVERS
The research utilized two receivers: one of electric
field, the RS4, used with a remote probe of a meter based 4 meters high
from the ground, in an open field, the second a receiver of magnetic field
with a loop multitourn of 75 cm of diameter based two meter high from the
ground situated very close to RS4. The two receivers have been tele-powered
with a 100 meters multi-core shielded, the same wire which have trasported
the signals received inside the station.
The two signals have been sent to two chanels of
a stereo recorder already arranged in order to making an automatic recording
starting from the programmable timer.
The target of all of this automatizzazione was
to reduce the manual operations of data collecting for spending that time
to analize the same data.

Electric Field receiver - RS4 |
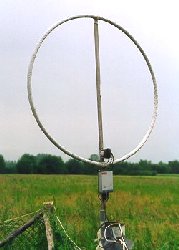
Magnetic Field receiver - RCM |
DATA STOCKING
The data collecting was done both in two different
ways: the first one with audio sessions in compact cassette, the second
one concerning numerical data about the solar activity at meteo conditions
CGM, and about the listening sessions and about the number of wistlers
gotten and recorder on the excel workpage.
Once a tape was completed, the complet sonogramma
was done and the obteined data were included in the computer workpage completing
the data necessary to the research.
NOT CORRELATION WITH SOLAR DATA
The first reflection coming out from the collected
data is the missing of possible links between wistler and the proceeding
of other greatnesses.
Its well known that wistlers originate from scharge
electric storm related to the magnetic ways (formed by solar activity)
and so these greatnesses are related and linked between themselves.
Comparing the collected data we couldnt find any
information about that. This doesnt mean that this link doesnt exist,
but it simply means that a single operator, with his own means, also via
Internet, cant prove the existence of this link.
So, the collected data doesnt allow to forecast
anything about the wistlers and their happening even in shorter times.
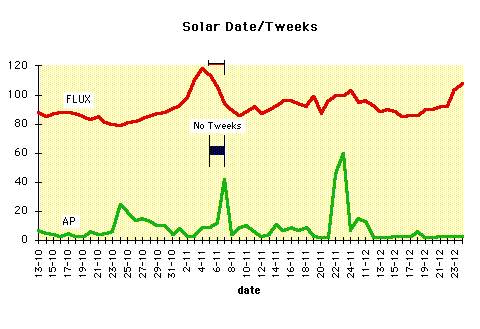
LINKS BETWEEN TWEEKS AND SOLAR FLUX
More than once it was evident that some links exist
between the presence of Tweeks and the intensity of the solar radio activity.
For twice in fact, during a very intense and anomal solar activity lasting
few days, tweeks desappear from night sonograms.
Their number is strictly related to the number
of statics but their intensity stongly seems related to the magnetic storms.
The following graphic shows this phenomenon and
the sonogram shows an active night with 4-frequency tweeks.

NON CORRELATION WX CGM
It is out of doubt and certain that at the beginning and origin to wistlers there must be a storm, but apparentelly the collected data about WX and CGM conditions, in our case in Cape Town, are not relyable enough. Data are related to the forecastings which, even if very accurate, leave space to a certain doubt because of the atmosferic weather. More than this during bad weather periods conditions can change in a short distance as few kilometers making the gotten data not very much relyable. The data collected during the whole year didnt show particular links between the tendence of WX to CGM and the number of receivable wistlers .

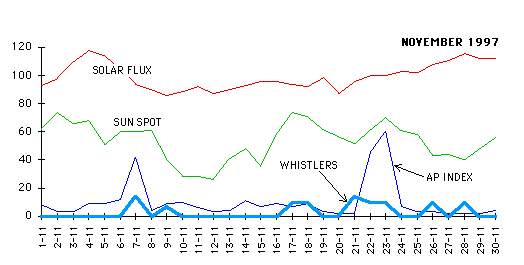
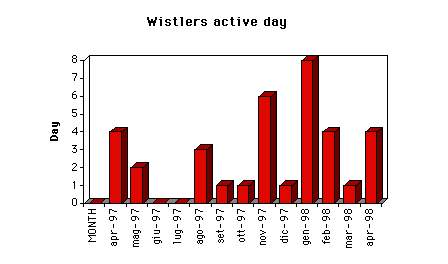
STATISTICS OF THE ACTIV DAYS MONTH PER MONTH
A very interesting data which came out from OPERA experience was the number of days during the year when is possible to listen to wistlers. If, for istance, you are planning listening sessions during the month of february, how many possibilities are they that during a single week you can really get in touch with wistlers? The following graphic gives you this answer. It is clear and obvious in fact that winter months are more favourable for the wistlers listening, knowing as well that the possibility of periods of complete inactivity even for quite long periods can happen.
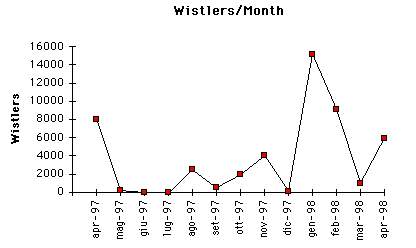
STATISTICS NUMBER OF WISTLERS PER MONTH
According to the previous data some rules have been
established in order to value, in a approximate way, the quantity of wistlers
receivable per single month. Since the sessions happened about every six
hours, was done the hypothesis that the type of the intensity of the phenomenon
was synusoidal, and this was obteined by calculating the quantity of wistlers
every six hours and multiplying the result gotten from the listening per
360 total minuts and dividing this value by 1,4.
Because of these calculations we can suppose that
during the observation period lasted a year we totally score 48500 wistlers.
Then, if we subdivide this value for the whole year we get a medium value
of 133 wistlers every day: a wistler every 11 minuts. In these statistics
it must be considered that the receiving station was not located in a completelly
isolated zone, and so we must consider that an 50 Hz noise could avoid
reception of even very weak segnals.
Even if not totally exact calculation or forecast,
this value gives anyway a very practical idea of
the general tendences of the phenomenon. As is
shown by the following graphic the winter periods are more favorable to
the wistlers listening signals.
STATISTICS ABOUT THE WISTLERS RECEPTION TIMES
Even if the presence of wistlers is detectable during day and night time is much easier to get these kind of signals during night time, and this is most valable during the summer time when automatic listening session have never received wistlers signal during the day. Long listening periods, while these phenomenons were present confirmed this tendence.
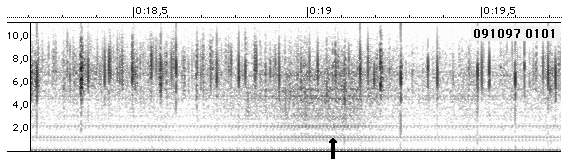
SIGNALS LINKED TO SISMIC PHENOMENONS
During the listening session for OPERA a very sad
event unfortunatelly hit the Italian peninsula which is a high sismic risk
zone. The very high number of earthwick has maybe given its contribution
to a lucky connection: when a very powerfull earthquick is close to happen
have been recorded emissions in magnetic mode and in electric mode, and
this happened 15 minutes before the first shake. The signal is very similar
to a cellophan sheet that, when wrinkled produces a noise wide band in
a receiver RS4. In certain moments it has even rose above the signals of
statiche present in banda. This signal has been received with stronger
intensity in magnetic receiver compared to the electric one.
The distance from earthwick was about 500 km.
The peculiarity of the recording is that also another
italian operator, living near the earthwick place , could record, in the
same period, very similar signals with even higher frequency. In the following
picture is shown the sonogramm of a part of this signal.
THOSE WEIRD SIGNALS
About natural origin radio signals there always
were rumours which had origins even from aliens and ghosts.
In order to deny spiritual powers about VLF, we
must say that in more than 1500 listening sessions done in a year, never
have been found particularly strange signals. Everything observerd and
recorded was part of the Radio Nature signals studies. The only exception
to this rule is the previous paragraph about earthquick: those signals
are not fully explained yet, despite, several studies have been done about
this complicated matter. All of this makes stronger and stronger the wish
men have to give a complete explanation of the physics rules which govern
our universe.
CONCLUSIONS
During the year object of the present research was possible to check:
1) Its easier to listen to wistlers during the night than in the day time
2) Its easier to listen to wistlers during winter than summer time
3) Making a random listening of few minutes in a winter night, you have 20% more possibilities to receive wistlers, while if the same operation takes place in summer time the possibility goes down to 3%
4) Tweeks are happening pratically every night even if with different intensity and frequency
5) While solar storm are happening, tweeks can attenuate or even totally desappear for a few days
6) In the data collected from OPERA is not that evident a direct link between the received wistlers and the CGM meteo conditions data
7) Moreover is not given a direct correspondence between solar activity data and the number or received wistlers.
MANY THANKS TO
Prof. Ezio MOGNASCHI (IW1GOO),
for tecnical support
Dr. Andrea BERTOCCHI, for
translate